
First look at the overall slope over several weeks, then check individual points using your calendar and notes.
A worked example
Imagine six morning readings over a month with two empty weeks between them. A line joins the points, but no measurements were made on the missing dates. Switching from seven days to a month adds earlier observations and changes the apparent slope. A sound summary is six observations in this window, with a substantial gap. It is not evidence that weight followed the connecting line every day. Open a questionable date in the calendar and check its conditions.
What to do
- 01
Open a period sufficient for your task, not just the last two days.
- 02
Note how many dimensions actually lie behind the line.
- 03
Find outliers and check conditions on the corresponding date.
- 04
Formulate a neutral conclusion: direction, stability and what cannot yet be stated.
Common mistakes
- Consider the connected line as a continuous measurement between sparse points.
- Drawing conclusions based on a graph scale that is too narrow.
- Ignore omissions and changes in measurement mode.
Check what supports the line
Name the period and count actual observations first. Check for changes in scale, time or units. A smooth connecting line does not make sparse measurements continuous, and chart scale can magnify a small change. Compare values and dates rather than angles on differently sized screens. Vesometr offers fixed viewing periods; switching between them neither creates readings nor produces a medical forecast. Correct a verified typing error in the original entry. The shape of a line alone is not sufficient reason to remove an inconvenient point.
How to check the result
- The viewing period is explicit.
- Missing dates are not described as measured values.
- Questionable points have been checked in the calendar.
For a numerical summary, see average weekly weight and retain the observation count.
How this works in Vesometr
In Vesometr statistics, you can switch 7 days, month, 3 months, year and the entire period, so as not to take the window scale for the result itself.
Sources and fact checking
App features were checked against Vesometr 1.2.2. External sources explain general guidance, rather than validating individual medical conclusions.
- NHS England — How to record your weight — Repeatable weighing conditions; this source does not determine an individual target.
- Vesometr 1.2.2 — Features checked against the Vesometr 1.2.2 release source.
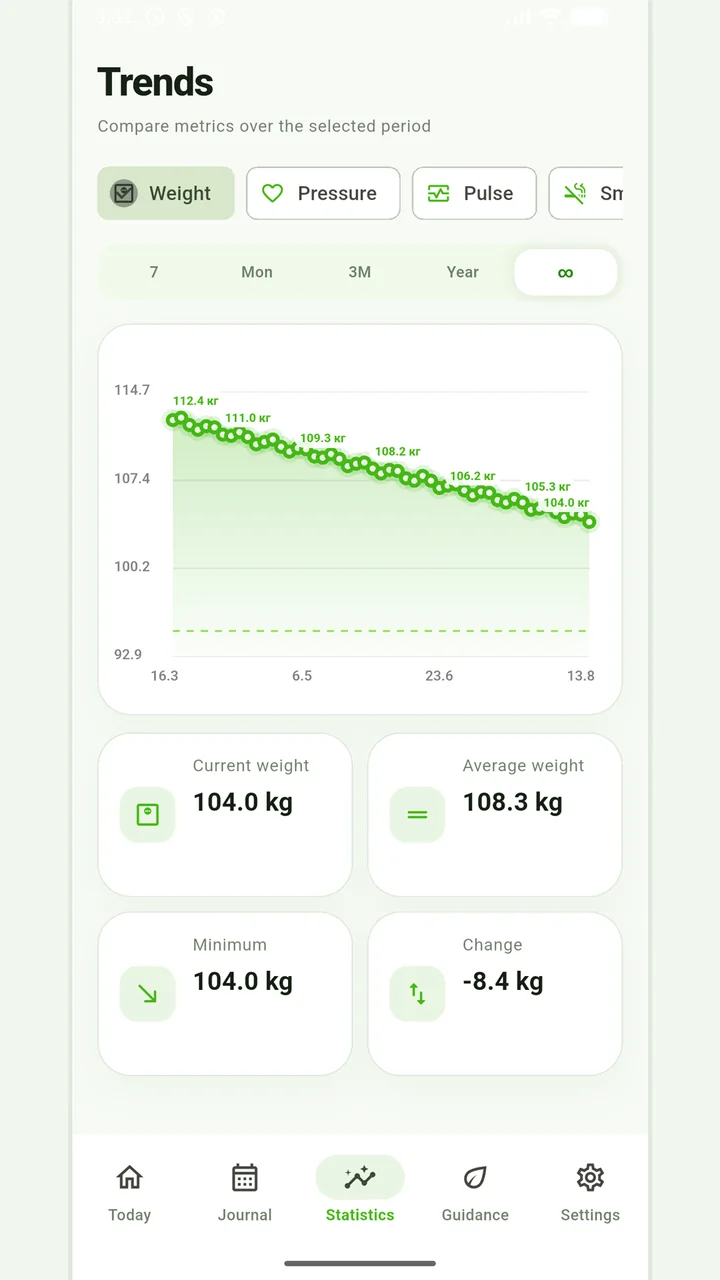
Weight trends
Charts, a target and period comparisons without judging progress by one number.
Don't use weight changes as the only way to assess your health. Unexplained rapid weight changes, severe swelling, weakness or other worrying symptoms should be discussed with your doctor.
Medical disclaimer